In this post we will discover how to:
- Store all sensor data into blob storage
- Calculate the average temperature and humidity for every 1 minute time-span
- Store the average temperature and humidity information to to Azure Tables
- Send the average temperature and humidity information to Power BI
- Create reports in Power BI to display information for the current day
- Create a web application that displays Power BI reports
Previous post: [IoT Home Project] Part 5 - Send data to Azure IoT Hub, control time interval and refac the configuration information
GitHub source code: https://github.com/vunvulear/IoTHomeProject
Store all sensor data into blob storage
Once we have sensor data in Azure IoT Hub, we can do anything with them. Let's create a Stream Analytics job that take sensor data from Azure IoT Hub and push it to Azure Blob Storage. Blob Storage is a very cheap place where you can store data. It is perfect to store bulk data.
The first step when you create a job for Stream Analytics is to specify Inputs and Outputs. For now, we will need as Input the IoT Hub. The input can be easily created, especially when Stream Analytic job and your instance of Azure IoT Hub are in the same subscription. I named my input data from IoT Hub - 'inputDeviceData'.
The output of the job will be Azure Blob Storage. For this we'll specify an output to the blob storage where we want to persist our content - ''outputSensorDataBlobStorage'. When you write to Blobs, multiple files are created. Because of this it is required to specify a container, where all the files will be created.
Last think that is necessary to do is to specify the query.
SELECT
    deviceId as deviceId,
    sensorInf.temp as temp,
    sensorInf.humidity as humidity,
    sensorInf.distance as distance,
    sensorInf.light as light,
    EventEnqueuedUtcTime as receivedTime
INTO
    outputSensorDataBlobStorage
FROM
    inputDeviceData TIMESTAMP BY EventEnqueuedUtcTime
WHERE
    msgType = 'sensorData'
In the SELECT we specified the list of fields that we want to store in the output. Do you remember the message format that we send in JSON format from Raspberry? This is how I know the name of each property from INPUT.
As you can see, there is a default property called 'EventEnqueuedUtcTime' that represents the time when the event arrived to Azure IoT Hub. I decided to ignore the device time and use this value as reference.
Final Stream Analytics Query: https://github.com/vunvulear/IoTHomeProject/blob/master/stream-analytics-jobs/dump-sensor-data-to-blob-calculate-avg-dump-to-azuretable-and-powerbi.sql
Calculate the average temperature and humidity for every 1 minute time-span
To calculate the average temperature for a specific time interval, the most simple way is on top of Stream Analytics. Each job allows us to specify a time window where we can apply different aggregation function like average (AVG).
SELECT
    deviceId as deviceId,
    System.TimeStamp as timeslot,
    AVG(sensorInf.temp) as avgtemp,
    AVG(sensorInf.humidity) as avghumidity,
    AVG(sensorInf.distance) as avgdistance,
    AVG(sensorInf.light) as avglight
INTO
    outputSensorDataConsolidatedTableStorage
FROM
    inputDeviceData TIMESTAMP BY EventEnqueuedUtcTime
WHERE
    msgType = 'sensorData'
GROUP BY
    deviceId,
    TumblingWindow(second, 60)
Last, but not least, we need to specify the output of our job, that will be in this case an Azure Table. Don't forget to do this job before writing the query. On top of table name you need to specify two additional fields. Partition Key and Row Key. This values represents the properties name from the query (SELECT) that will be used to set Partition Key and Row Key.
This values are mandatory and are important. The combination of this two keys forms key of the entity that is stored in Azure Table. This combination needs to be unique and is used to retrieve data from tables.
For cost optimization you can increase the batch size to 10 or 50. But in our case the impact of cost is low and will force us to see data in Azure Table only after 10 or 50 minutes - we don't want this.
Both queries can be inside the same job.

Final Stream Analytics Query: https://github.com/vunvulear/IoTHomeProject/blob/master/stream-analytics-jobs/dump-sensor-data-to-blob-calculate-avg-dump-to-azuretable-and-powerbi.sql
Send the average temperature and humidity information to Power BI
For Power BI, the trick is not to send data, there is already a connector build-in Stream Analytics. The trick is create and use Power BI. It is not complicated at all, but is might be something new. For me, it was the first time when I used Power BI as service and I didn't need more than 2 hours to discover all things that I need.
First, you need to go to https://powerbi.microsoft.com/en-us/ and subscribe for a new account. Once you do this, you can go back to Stream Analytics and create a new output for Power BI. Dataset name and Table name will be later used to create the reports.
The query that send data to Azure Table and the one used to send data to Power BI looks the same. The only difference is the output. We can calculate the AVG data only once and send it to both outputs. This is done using WITH statement that defines a temporary source - if we can call it in this way. The final query should look like this:
WITH avgdata AS (
SELECT
    deviceId as deviceId,
    System.TimeStamp as timeslot,
    AVG(sensorInf.temp) as avgtemp,
    AVG(sensorInf.humidity) as avghumidity,
    AVG(sensorInf.distance) as avgdistance,
    AVG(sensorInf.light) as avglight
FROM
    inputDeviceData TIMESTAMP BY EventEnqueuedUtcTime
WHERE
    msgType = 'sensorData'
GROUP BY
    deviceId,
    TumblingWindow(second, 60)
)

SELECT
    *
INTO
    outputSensorDataConsolidatedTableStorage
FROM
    avgdata

SELECT
    *
INTO
    outputPowerBIDataConsolidated
FROM
    avgdata
Final Stream Analytics Query: https://github.com/vunvulear/IoTHomeProject/blob/master/stream-analytics-jobs/dump-sensor-data-to-blob-calculate-avg-dump-to-azuretable-and-powerbi.sql
Now, that we have defined all inputs and outputs for Stream Analytics, let's take a look how it should look like (see below).

Even if this might sounds complicated is extremely simple. If you navigate to Power BI dashboard for your app, you'll be able to find in Datasets 'iot' with a table called 'sensorConsolidated' (see definition of the Stream Analytics Output from the image below). This will be used to generate our reports.
To display a chart that display the average temperature data you need to:
- Create a new report in 'Reports' section
- Select 'Area Chart' ad drag a new chart
- Select 'avgtemp' and 'timeslot' from fields section
We need time-slot field because the this fields contains the minute for which the average temperature is calculated.
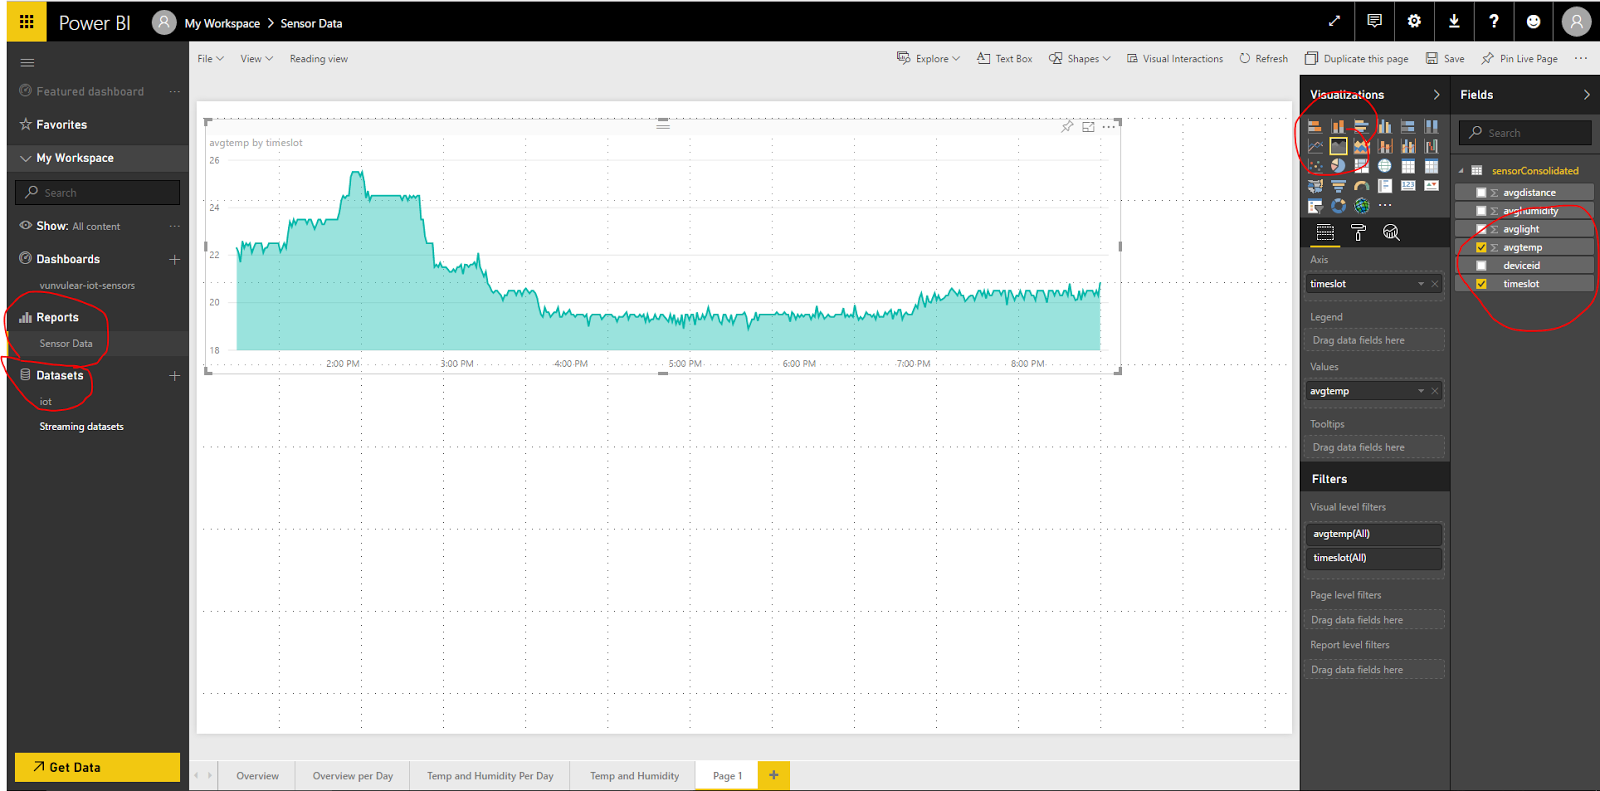
You can create similar reports for other fields also. Feel free to play around with different time of reports. Also, if you want you can drag fields to 'Values' section, that allows us to calculate the min/max/avg for a specific interval. In my case, for each data, as you will see in the image from the next section, where I created a small dashboard.
I don't want to go to deep in Power BI, because it's a complex subject. The tool is extremity powerful and can be used to create in a few seconds powerful reports.
Create a web application that displays Power BI reports
The cool thing and Power BI is that allows us to export the report to a web page. Basically, from the report we can get the HTML and needs to be added to the page where we want to show our reports. The HTML is an iframe that is populated by Power BI. Pretty cool.
From Report if you go to 'File>Publish To Web' you shall end up in the right location where iframe is generated and ready to copy/paste.

To publish the report we'll create a Web App (Free tier is enough) with an empty page where will past the iframe HTML from Power BI. You'll see on GitHub that I created a empty ASP.NET Core application that I deployed in the Web App. This was only for fun. In this moment index.html page that is under 'wwwroot' is more than enough.
Don't wary if you see that the report is not updated in you web app every second. Inside Power BI there is a cache for reports that updates every 1 hour.
Don't wary if you see that the report is not updated in you web app every second. Inside Power BI there is a cache for reports that updates every 1 hour.
The web app is live for now - http://vunvulear-iot-portal.azurewebsites.net. I don't know for how long I will keep the web app, but now is working (smile). A print screen can be found below.
The source code for this web app can be found on GitHub: https://github.com/vunvulear/IoTHomeProject/tree/master/webapp-iot-portal
The source code for this web app can be found on GitHub: https://github.com/vunvulear/IoTHomeProject/tree/master/webapp-iot-portal
HINT: To be able to set as default page index.html in a ASP.NET Core application you need to navigate to Startup.cs and specify in the Configure method to use default files and load static content. Static content is expected to be found under wwwroot folder.
        public void Configure(IApplicationBuilder app)
        {
            app.UseDefaultFiles();
            app.UseStaticFiles();
        }
At the end of the post, let's take a look on our web report dashboard.

Conclusion
Each time I'm impressed how we can create and deliver functionality so easy using out-of-the-box services. Stream Analytics and Power BI change the way how we need to write our applications.
Next post
[IoT Home Project] Part 7 - Read/Write data to device twin
Next Step
In the next post we will start to use device twin to control how often sensor data are send to Azure IoT Hub.
Comments
Post a Comment